Tracking Memory Leaks in React with DevTools and Performance Profiling

Introduction
You build a feature, test it locally, ship it, and it works great. Until someone leaves it open in a tab for two hours and the whole thing falls apart. Scrolling freezes, clicks stop registering, browser crashes.
Memory leaks are sneaky that way. There's no build error, no red warning. They just quietly pile up while your app is running in production. In SPAs where users keep dashboards open all day, this stuff matters as much as your initial load time.
In this blog, we will break down :
- What memory leaks actually look like in React.
- The architectural patterns that cause them (and why they're so easy to miss).
- How to track them down with Chrome DevTools.
- Concrete before/after code fixes.
How Memory Leaks Show Up in Production
You usually notice something's off before you can name the cause :
- Memory usage keeps climbing without leveling off
- Scrolling and UI interactions become progressively slower
- CPU usage inches up during normal use
- Components behave strangely after navigating back to them
- Event listeners firing multiple times
- WebSocket or subscription counts growing over time
- "Aw, Snap!" crashes after the app's been running a while
These rarely surface during a quick dev session, which is exactly why they're so annoying to catch.
What Actually Is a Memory Leak in React?
JavaScript handles memory automatically through garbage collection. When you create objects, strings, or components, memory gets allocated. Once nothing in your app references those things anymore, the engine reclaims the memory.
In React, a component that unmounts cleanly leaves nothing behind. Its state, DOM nodes, and closures are all eligible for collection.
A leak happens when something keeps a reference alive after it's no longer needed. The GC sees an active reference and leaves it alone. Do that enough times and you've got a growing pile of orphaned memory that never gets freed.
The Common Culprits
Memory leaks in React almost always trace back to three major architectural culprits:
1. Timers and subscriptions with no cleanup
A setInterval or subscription you start inside a component is tied to the browser environment, not React. When the component unmounts, React walks away, but the interval keeps running. Everything in its closure stays in memory.
2. Global Event Listeners That Never Get Removed
Adding a listener to window or document inside useEffect without cleaning it up means every time that component mounts, you add another listener. The old ones never leave.
3. Async Operations Holding State References
If a long-running fetch or a global store keeps a reference to a component's local state or a callback after the component has unmounted, that entire component branch can stay stuck in memory.
Tracking Down Leaks with Chrome DevTools
Don't try to guess your way through this profile it. Here's a practical workflow :
Step 1 : Get a clean starting point
- Open the app in Incognito (browser extensions pollute heap data). Go to DevTools → Memory tab → Heap Snapshot → Take snapshot. That's your baseline.
Step 2 : Trigger the Suspected Leak
- Memory leaks reveal themselves through repeated behavior. Navigate to the component you're suspicious about, interact with it, then navigate away. Do this 5–10 times to let the problem accumulate.
Step 3 : Take a Second Snapshot
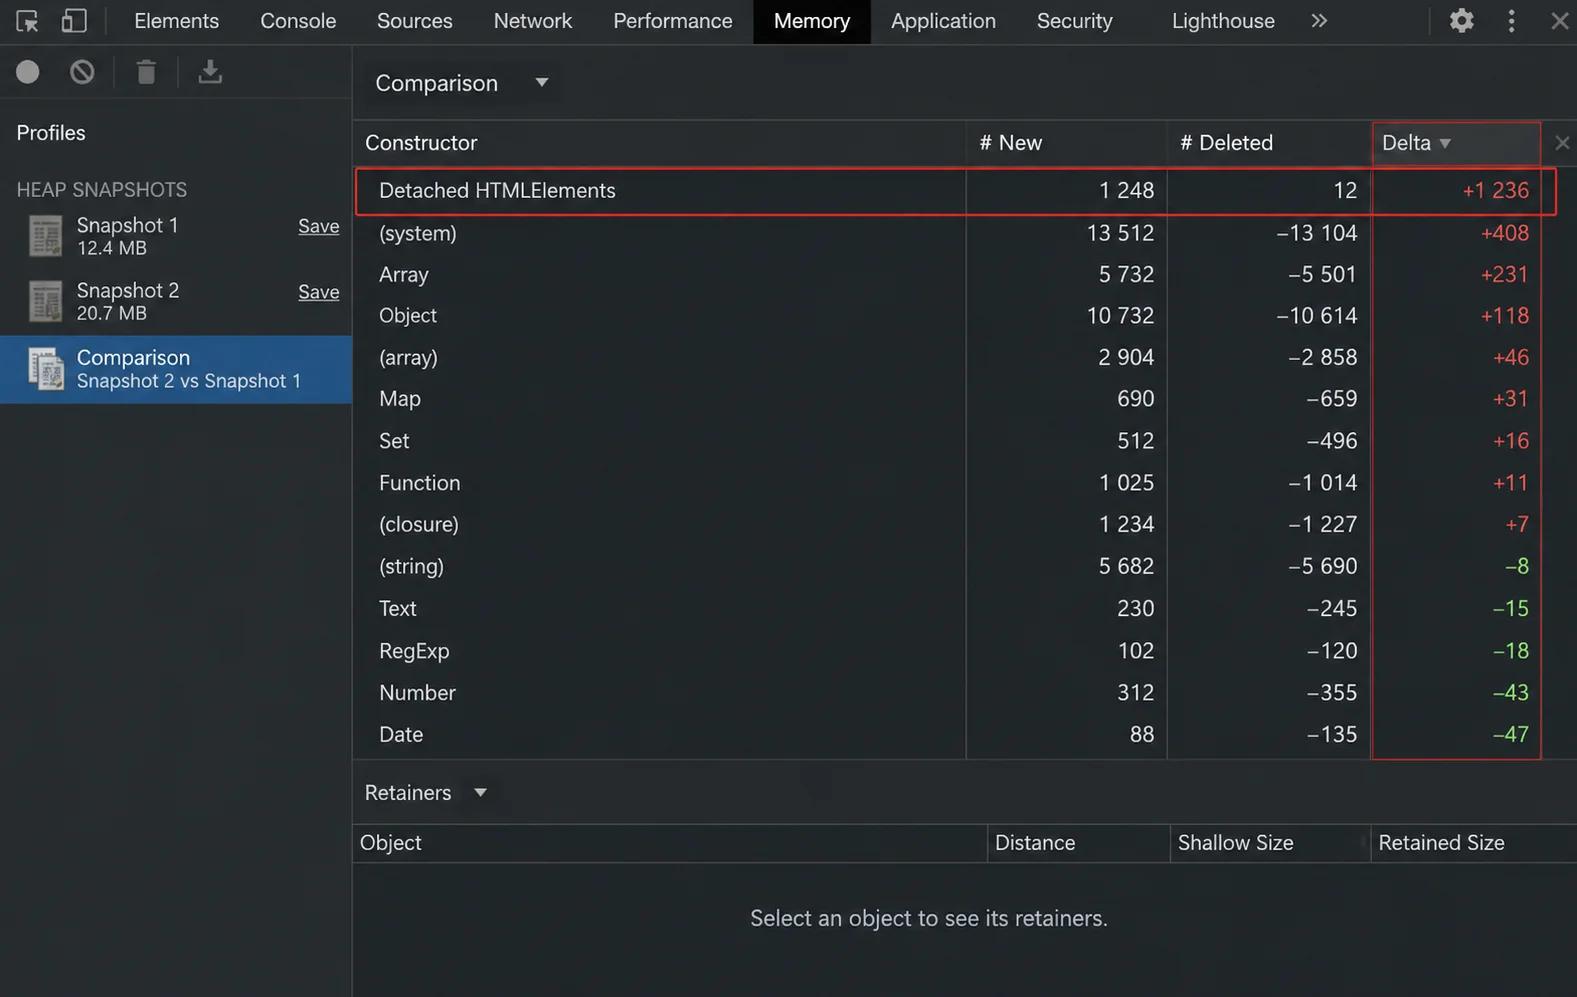
- Back in the Memory tab, take another snapshot. Switch the dropdown from Summary to Comparison, with your first snapshot as the reference.
- What to look for: Force a garbage collection cycle before taking the second snapshot. If you see constructors like Detached HTMLElement or FiberNode growing, especially with counts that match your mount/unmount cycles, you've confirmed a leak.
Pro Tip for Analyzing the Heap
Positive growth alone does not necessarily indicate a leak. Force a garbage collection cycle before taking the second snapshot and look for objects that continue growing after repeated mount/unmount cycles. If you see constructors like Detached HTMLElement, FiberNode (React's internal representation of components), or array allocations consistently growing (+5 or +10 corresponding exactly to your cycle count), you have successfully confirmed a memory leak.
Before and After: Real Code Fixes
Let's look at real-world examples of leaky code patterns alongside their production-ready fixes.
Case 1 : The Interval That Never Stops
The leaky version :
1import { useState, useEffect } from 'react';
2
3function RealTimeTracker() {
4  const [metrics, setMetrics] = useState(null);
5
6  useEffect(() => {
7    // Runs forever after unmount
8    setInterval(() => {
9      fetch('/api/live-metrics')
10        .then(res => res.json())
11        .then(data => setMetrics(data));
12    }, 2000);
13  }, []);
14
15  return <div>Metrics: {JSON.stringify(metrics)}</div>;
16}
The fix :
1import { useState, useEffect } from 'react';
2
3function RealTimeTracker() {
4  const [metrics, setMetrics] = useState(null);
5
6  useEffect(() => {
7    const intervalId = setInterval(() => {
8      fetch('/api/live-metrics')
9        .then(res => res.json())
10        .then(data => setMetrics(data));
11    }, 2000);
12
13    return () => clearInterval(intervalId);
14  }, []);
15
16  return <div>Metrics: {JSON.stringify(metrics)}</div>;
17}
Save the ID, clear it on unmount. That's literally it.
Case 2 : The Event Listener That Multiplies
The leaky version :
1import { useEffect } from 'react';
2
3function ResizeMonitor() {
4  useEffect(() => {
5    window.addEventListener('resize', () => {
6      console.log('Window resized!', window.innerWidth);
7    });
8  }, []); // No cleanup
9
10  return <div>Resizing tracks active...</div>;
11}
The fix :
1import { useEffect } from 'react';
2
3function ResizeMonitor() {
4  useEffect(() => {
5    const handleResize = () => {
6      console.log('Window resized!', window.innerWidth);
7    };
8
9    window.addEventListener('resize', handleResize);
10
11    return () => window.removeEventListener('resize', handleResize);
12  }, []);
13
14  return <div>Resizing tracks active...</div>;
15}
The key change is to name the handler function so you can reference it in removeEventListener. Anonymous functions can't be removed because the browser has no way to match them.
Profiling Tool Quick Reference
Different profiling tools within DevTools excel at tracking down different behaviors. Use this quick reference guide to pick your starting point :
| DevTools Feature | Best For | What It Shows |
|---|---|---|
| Heap Snapshot | Point-in-time comparison | Retained objects, DOM nodes, closures |
| Allocation Instrumentation on Timeline | Live monitoring | Allocations that aren't getting freed |
| Performance Panel | Full interaction audit | Memory patterns alongside FPS drops and CPU load |
The performance gain depends on your app. Apps with lots of components, derived data, or frequent re-renders will see the biggest improvements.
Habits Worth Building
- Every senior dev has shipped a listener they forgot to remove. The fix isn't better memory, it's treating the useEffect return block as non-negotiable. Set up a timer, a listener, a socket? The cleanup goes in immediately, before you write another line.
WebSocket example :
1useEffect(() => {
2  const socket = new WebSocket('wss://example.com/live');
3
4  socket.onmessage = (event) => {
5    console.log(event.data);
6  };
7
8  return () => {
9    socket.close();
10  };
11}, []);- Use AbortController for fetches. Slow network requests that try to update state after a component has unmounted are a common source of both warnings and subtle leaks.
- Lean on your linter. The eslint-plugin-react-hooks ruleset catches dependency array issues that lead to stale closures. Turn it on and treat its warnings seriously.
- Read the docs for third-party libraries. D3, Chart.js, Google Maps — none of them know about React's lifecycle. Look for .destroy() or .remove() methods and call them in your cleanup.
Going Deeper : Modern React Techniques
Taking your debugging a step further requires understanding how modern React features and asynchronous requests interact with component lifecycles.
1. Embracing React 18 Strict Mode
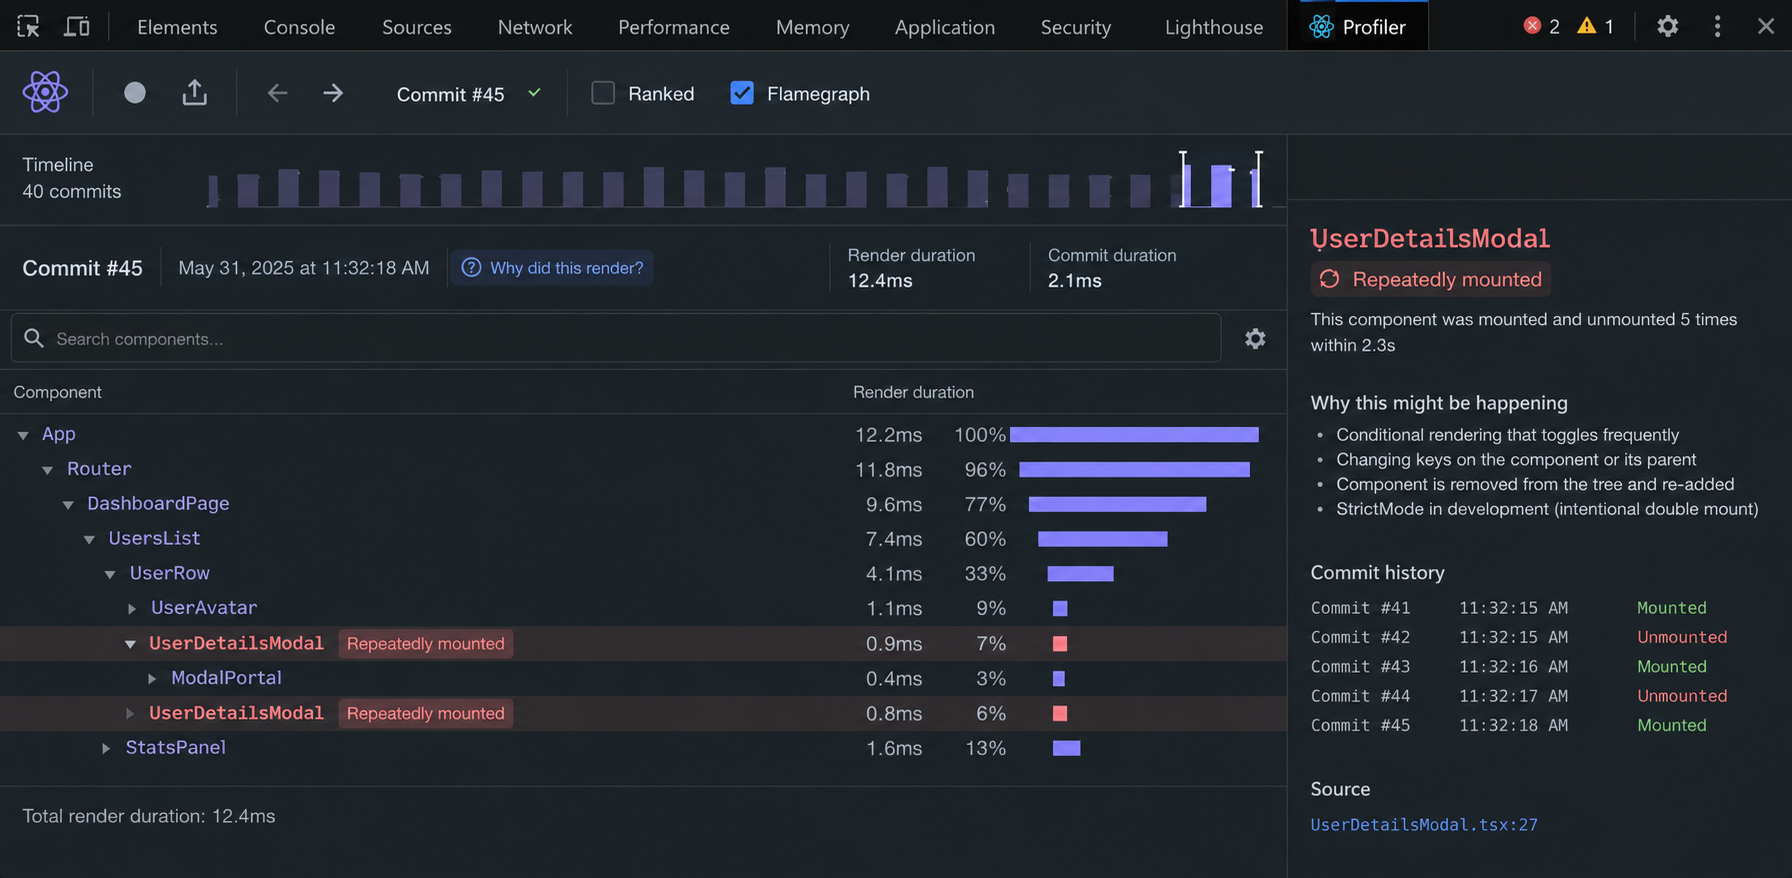
React 18 Strict Mode is your friend. In development, Strict Mode intentionally runs effects twice mount, cleanup, mount again. If your app behaves strangely or you see duplicate data in development, that's the feature working as intended. It's telling you your cleanup logic is broken or missing.
2. Canceling Async Requests with AbortController
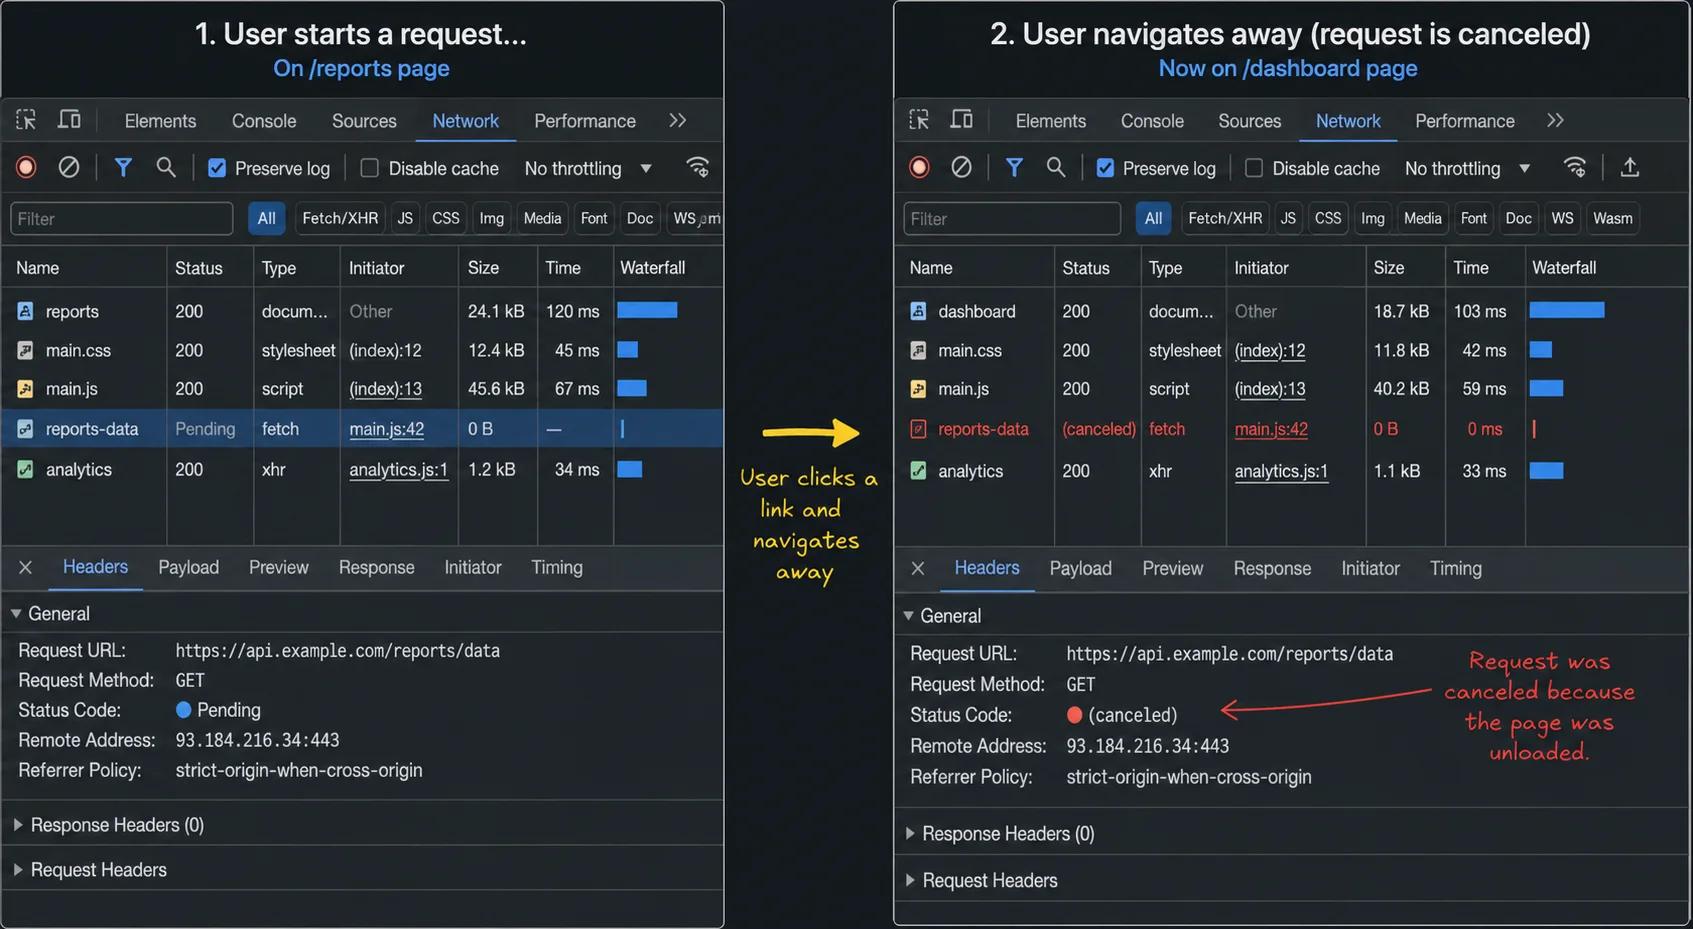
Here's a scenario most React devs have hit: user clicks something, triggers a fetch, navigates away before it finishes. The request completes anyway and tries to set state on a component that's already gone. Modern React quietly swallows the warning, but the underlying issue is still there. Pass an AbortController signal into your fetch and cancel it on unmount problem solved.
1import { useState, useEffect } from 'react';
2
3function UserProfile({ userId }) {
4  const [user, setUser] = useState(null);
5
6  useEffect(() => {
7    const controller = new AbortController();
8
9    fetch(`/api/users/${userId}`, { signal: controller.signal })
10      .then(res => res.json())
11      .then(data => setUser(data))
12      .catch(err => {
13        if (err.name === 'AbortError') {
14          console.log('Fetch aborted on unmount');
15        }
16      });
17
18    return () => controller.abort();
19  }, [userId]);
20
21  return <div>{user ? user.name : 'Loading...'}</div>;
22}
Component unmounts → request cancels → no stale updates.
Verifying Request Cancellation
The pending request is automatically canceled when the component unmounts, preventing unnecessary processing and reducing the risk of stale state updates.
3. The Danger of Third-Party Instantiations
Third-party libraries are where a lot of "I have no idea where this leak is coming from" moments originate. You wrap a chart or a map in a component, everything looks fine, but under the hood the library is holding onto a pile of data and DOM references that never get freed. Check the docs for a teardown method — most libraries have one — and wire it into your useEffect return.
Conclusion
Honestly, most memory leaks come down to one thing — something got started and never got stopped. Timers, listeners, fetches, subscriptions — React isn't the culprit. The component lifecycle is. Once you start seeing leaks that way, the fixes become pretty obvious.
Chrome DevTools gives you the receipts. Heap snapshots and allocation profiling turn "I think something's leaking" into "here's exactly what's leaking and why." Add that to a habit of always writing cleanup alongside setup, and you'll catch the majority of issues long before users do.
Start profiling early. It takes ten minutes during development and can save you a full day of production debugging.